Goals and Background
The main goal of the assignment is to become familiar with regression analysis. During this assignment SPSS will be utilized to calculate the regression output. Additionally, the assignment will provide experience mapping
Standardized Residuals using ArcMap and connecting statistics to the resulting spatial output.
Definitions
Regression analysis: is a statistical evaluation of the influence the independent variable has on the dependent variable.
- Can only be done with 2 variables
- Results of regression included the following
- Trendline equation
- Coefficient of Determination (r²)
- explanation variable of how well the dependent variable is explained by the independent variable.
- Range between 0-1, the closer to 1 the higher the dependent variable is explained by the independent variable.
- Standard Error of the Estimate (SEE)
- Result of the standard deviation of the residuals
- Residuals are how far the points vary from the trendline
Residuals is how far the actual data points deviate from the trendline or the plane (multiple regression). The residuals show which data points are outliers compared to the average in a positive or negative fashion.
Multiple regression analysis: is a statistical evaluation of the influence of multiple independent variable on a dependent variable.
- Only one dependent variable
- Can have multiple independent variables
Multicollinearity of multiple regression influences the results. Multicollinearity influences your results when two of the independent variables are highly correlated thus pulling the plane of the regression in one direction more than it should. The test for multicollinearity follows the following three test values output in SPSS.
- Eigen Values close to the numerical value of 0 tells the analysis multicollinearity could be present in the data.
- High Condition Indexes (HCI) over the numerical value of 30 tells the analyst multicollinearity is present in the data. However, the HCI does not state which independent variable is causing the multicollinearity
- Variance Properties (VP) close to the numerical value of 1 are the most likely to be causing the multicollinearity.
Part 1
Scenario
I was provided data for a neighborhood which contained the percent of kids that get free lunch in the given areas and the crime rate per 100,000 people. Then I was provided the following situation:
"A study on crime rates and poverty was conducted for Town X. The local news station got a hold of some data and made a claim that as the number of kids that get free lunches increase so does crime."
I was then instructed to answer the following questions:
- Determine if the news stations claim is correct using SPSS?
- A new area of town was identified to have 23.5% of kids getting free lunch, so what would the corresponding crime rate be?
- How confident am I in the results for question 2?
Methods
I completed the regression analysis in SPSS using the Excel file which contained the data for the neighborhood. The
Crime Rate was the
Dependent variable and the
Percent of kids getting free lunch was the
Independent variable (Fig. 1).
 |
| (Fig. 1) Linear Regression window in SPSS with the inputs of the dependent and independent variables. |
Results
 |
| (Fig. 2) Regression analysis results from SPSS for % of kids with free lunch (Independent) and crime rate (Dependent). |
Looking at the results in Fig. 2 you can see the
R Square vale of .173 under the
Model Summary heading. The
R Squared value of .173 is very low which tells me the % of free lunches does not explain the crime rate for the given neighborhood. The
Sig. level found under the
Coefficients heading for
PerFreeLunch of .005 has little merit with such a low
R Squared value.
Conclusion
Based on the results of the regression analysis the news report was incorrect. Crime rate is not related to the % of children whom get free lunches. I am making an assumption the reported calculated the basic
Bivariate Correlation between the variables which resulted in the .005 significance value and a Pearson Correlation of .416. The results of the correlation tells you they are correlated but doesn't tell you why. (For more on correlation see my blog for
Assignment 5) In this case the regression analysis shows the two variables are not "dependent" of each other.
 |
| (Fig. 3) Correlation results for % free lunches to crime rates calculated in SPSS. |
Part 2
Scenario
I was provided data for 911 calls in Portland, OR. Then I was provided the following scenario:
"The City of Portland is concerned about adequate responses to 911 calls. They are curious what factors might provide explanations as to where the most calls come from. A company is interested in building a new hospital and they are wondering how large an ER to build and the best place to build it."
The data I was provided contained the following:
- Calls (number of 911 calls per census tract)
- Jobs
- Renters
- LowEduc (Number of people with no HS Degree)
- AlcoholX (alcohol sales)
- Unemployed
- ForgnBorn (Foreign Born Pop)
- Med Income
- CollGrads (Number of College Grads)
I will answer the following questions for the given scenario:
- What factors may provide explanation of where the most calls come from in Portland, OR.
- Where is the best place to build a new ER.
I cannot answer what size of ER to build with the given data so will not be answering that question.
Methods
I utilized SPSS to complete regression analysis using
Calls as the dependent variable (Fig. 3). I ran numerous regressions analysis using each of the other variables as the independent variable.
 |
| (Fig. 3) Linear Regression window in SPSS with the inputs of the dependent and independent variables. (One of many which were calculated). |
Next, a map was created displaying the number of 911 calls by Census Tract (Fig. 9) in ArcGIS along with a map of the residuals of between the 911 calls and renters (Fig. 10).
Then a multipule regression was ran using SPSS with the Collinearity Diagnostics turned on using the
Enter method for the same data which was ran separately (Fig. 11 & 12). Then another multipule regression was calculated using the
Stepwise method.
Results
 |
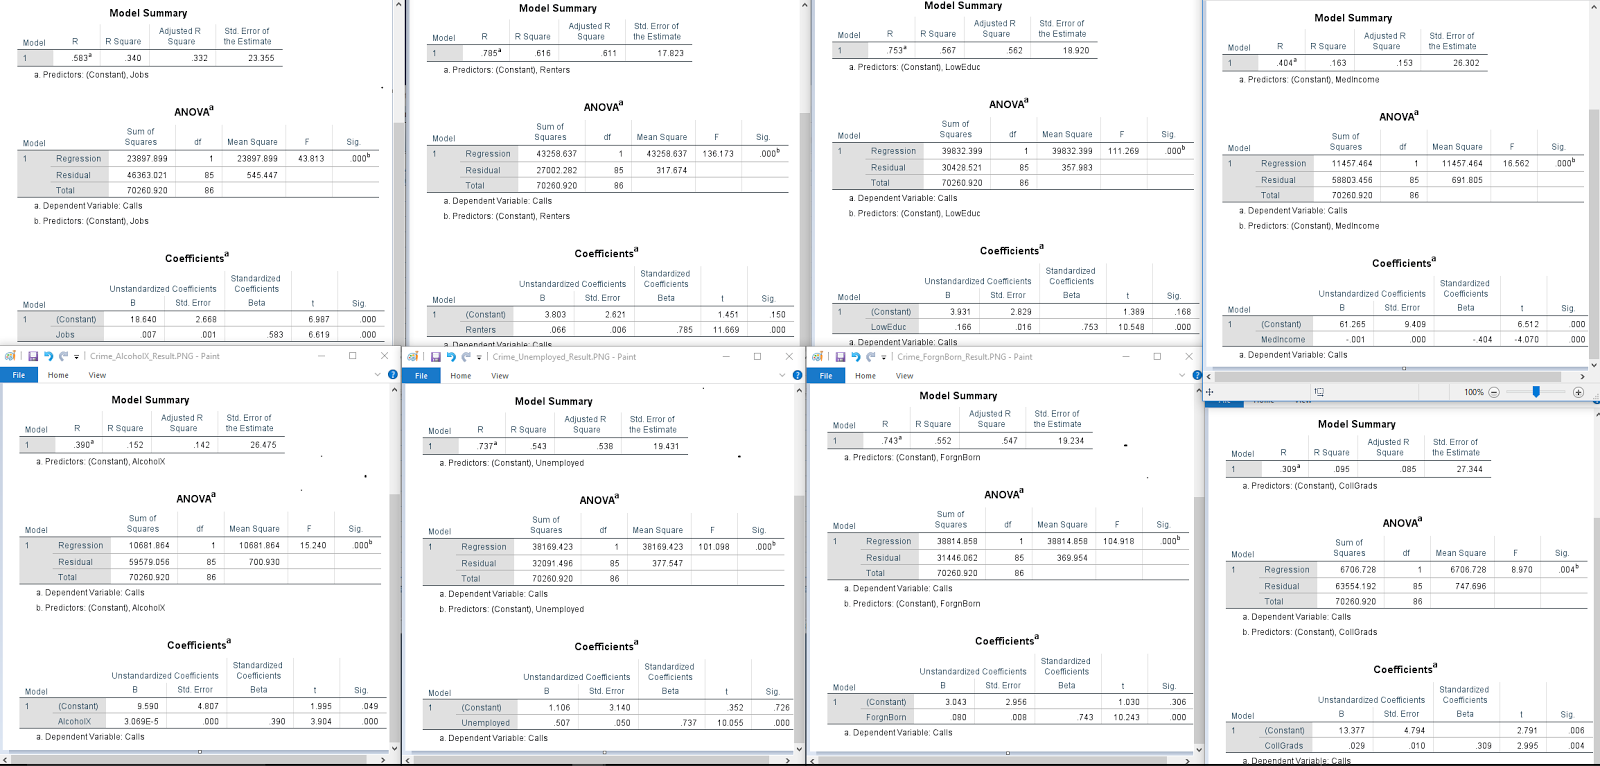
| (Fig. 4) Image containing all of the resulting regression analysis for each factor possibly affecting the # of 911 calls. |
The regression analysis between Renters and the # of 911 calls stands out the most when looking at all of the results in Fig.4 (Fig. 5). The
R-Squared value is .616 which is the highest of all the results. Additionally, the
Sig. value is .000 which tells us to reject the null hypothesis which is "The number of renters does not influence the # of 911 calls". Looking at the
Constant value one can see for every 1 value the crime rate increases the # of 911 calls increases by 3.8. The
R-squared only explains about 60% of the reason for the 911 calls. Looking at the other results such as
Unemployed,
LowEduc,
ForgnBorn also have high
R-squared values which help explain additional influencing factors for 911 calls (Fig. 6-8). An assuption to be made is there is some correlation between the other three categories (
Unemployed,
LowEduc,
ForgnBorn) and
Renters. However, the question asked was only about the influencing factors on 911 calls so I will not be calculating those values.
 |
| (Fig. 5.) Regression analysis results between Renters and # of 911 calls. |
 |
| (Fig. 6) Regression analysis results between Unemployed and # of 911 calls. |
 |
| (Fig. 7) Regression analysis results between LowEduc and # of 911 calls. |
 |
| (Fig. 8) Regression analysis results between Unemployed and # of 911 calls. |
 |
| (Fig. 9) Standard deviation display of the number of 911 calls in Portland, Oregon. |
The blue areas in Fig. 9 are displaying areas which have lower than average 911 calls compared to the average of all the Census Tracts. The brown areas are slightly above the average of 911 calls.
 |
| (Fig. 10) Residual display by standard deviation between the # of 911 calls and Renters in Portland, Oregon. |
The peach to red colors show residuals which are higher (above the trendline) than the average. You can see the relationship between the 911 calls which are high in Fig. 9 and the peach to red areas of Fig. 10. These areas have a higher relationship between 911 calls and renters for the Portland area.
 |
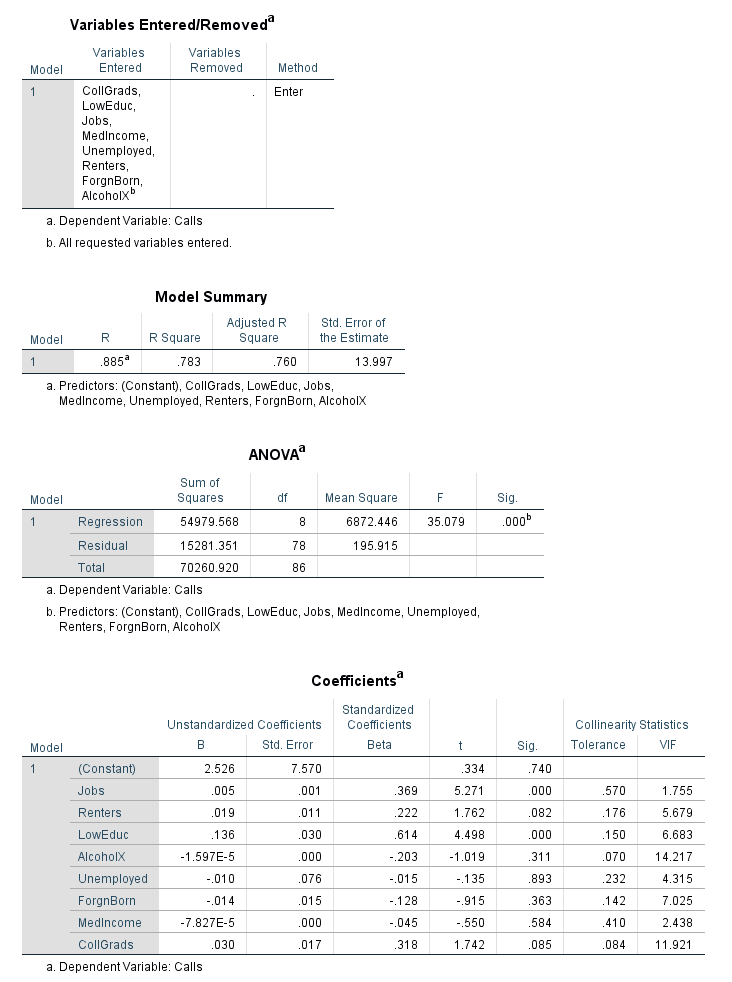
| (Fig. 11) Multiple regression result using the Enter method. |
The R-squared value for the multiple regression of .783 shows the strength between the variable is high. Investigating the
Standardized Coefficients Beta tells us
LowEduc his the best predicting variable for 911 calls as is the highest absolute value. The
Beta value shows
LowEduc explains ~61% of the 911 calls. The significance level is also .000 which states there is a relationship between the # of 911 calls and
LowEduc.
 |
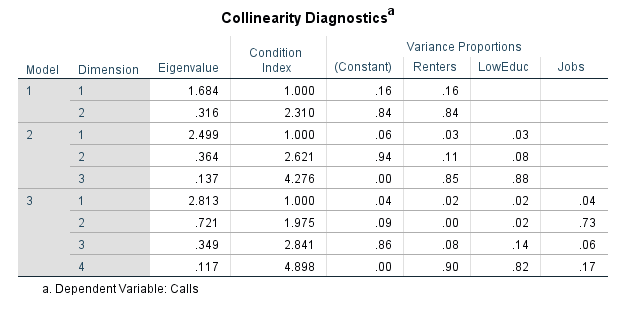
| (Fig. 12) Multiple regression collinearity diagnostics result. |
Based on the defined parameters above there is no issue with multicollinearity with this set of data.
 |
| (Fig. 13) Variable display from the results of the multiple regression analysis using the Stepwise method. |
 |
| (Fig. 14) Utilized and excluded variables result from the multiple regression using the Stepwise method. |
Analyzing Fig. 14 you can see SPSS selected out
Renters, LowEduc, and
Jobs as the best independent variables which explain the # of 911 calls. These results are very similar to my first analysis with
Jobs being the only variation. The single regression analysis pointed me to
Unemployed which is obviously closely related to
Jobs. In the third model
LowEduc is still the highest predictor of 911 calls in the Portland area due to having the highest
Beta value. The
Beta value shows
LowEduc explains ~46% of the 911 calls while
Jobs explain ~34%.
 |
| (Fig. 15) Collinearity diagnostics results from the Stepwise method. |
Again, based on the above parameters there is no multicollinearity with the values selected by the
Stepwise process in SPSS.
Conclusion
There is a slight variation between the methods of regression analysis preformed. The multiple regression using the
Enter method using all of the variables shows how factors can influence and alter the results making them less accurate than the
Stepwise method. Both methods result in the same independent variable being the primary factor influencing the 911 calls. However, the amount which the variable explained the 911 calls varied between the methods. The variance resulted from the influence of the other variables affecting the plne of the multiple regression.